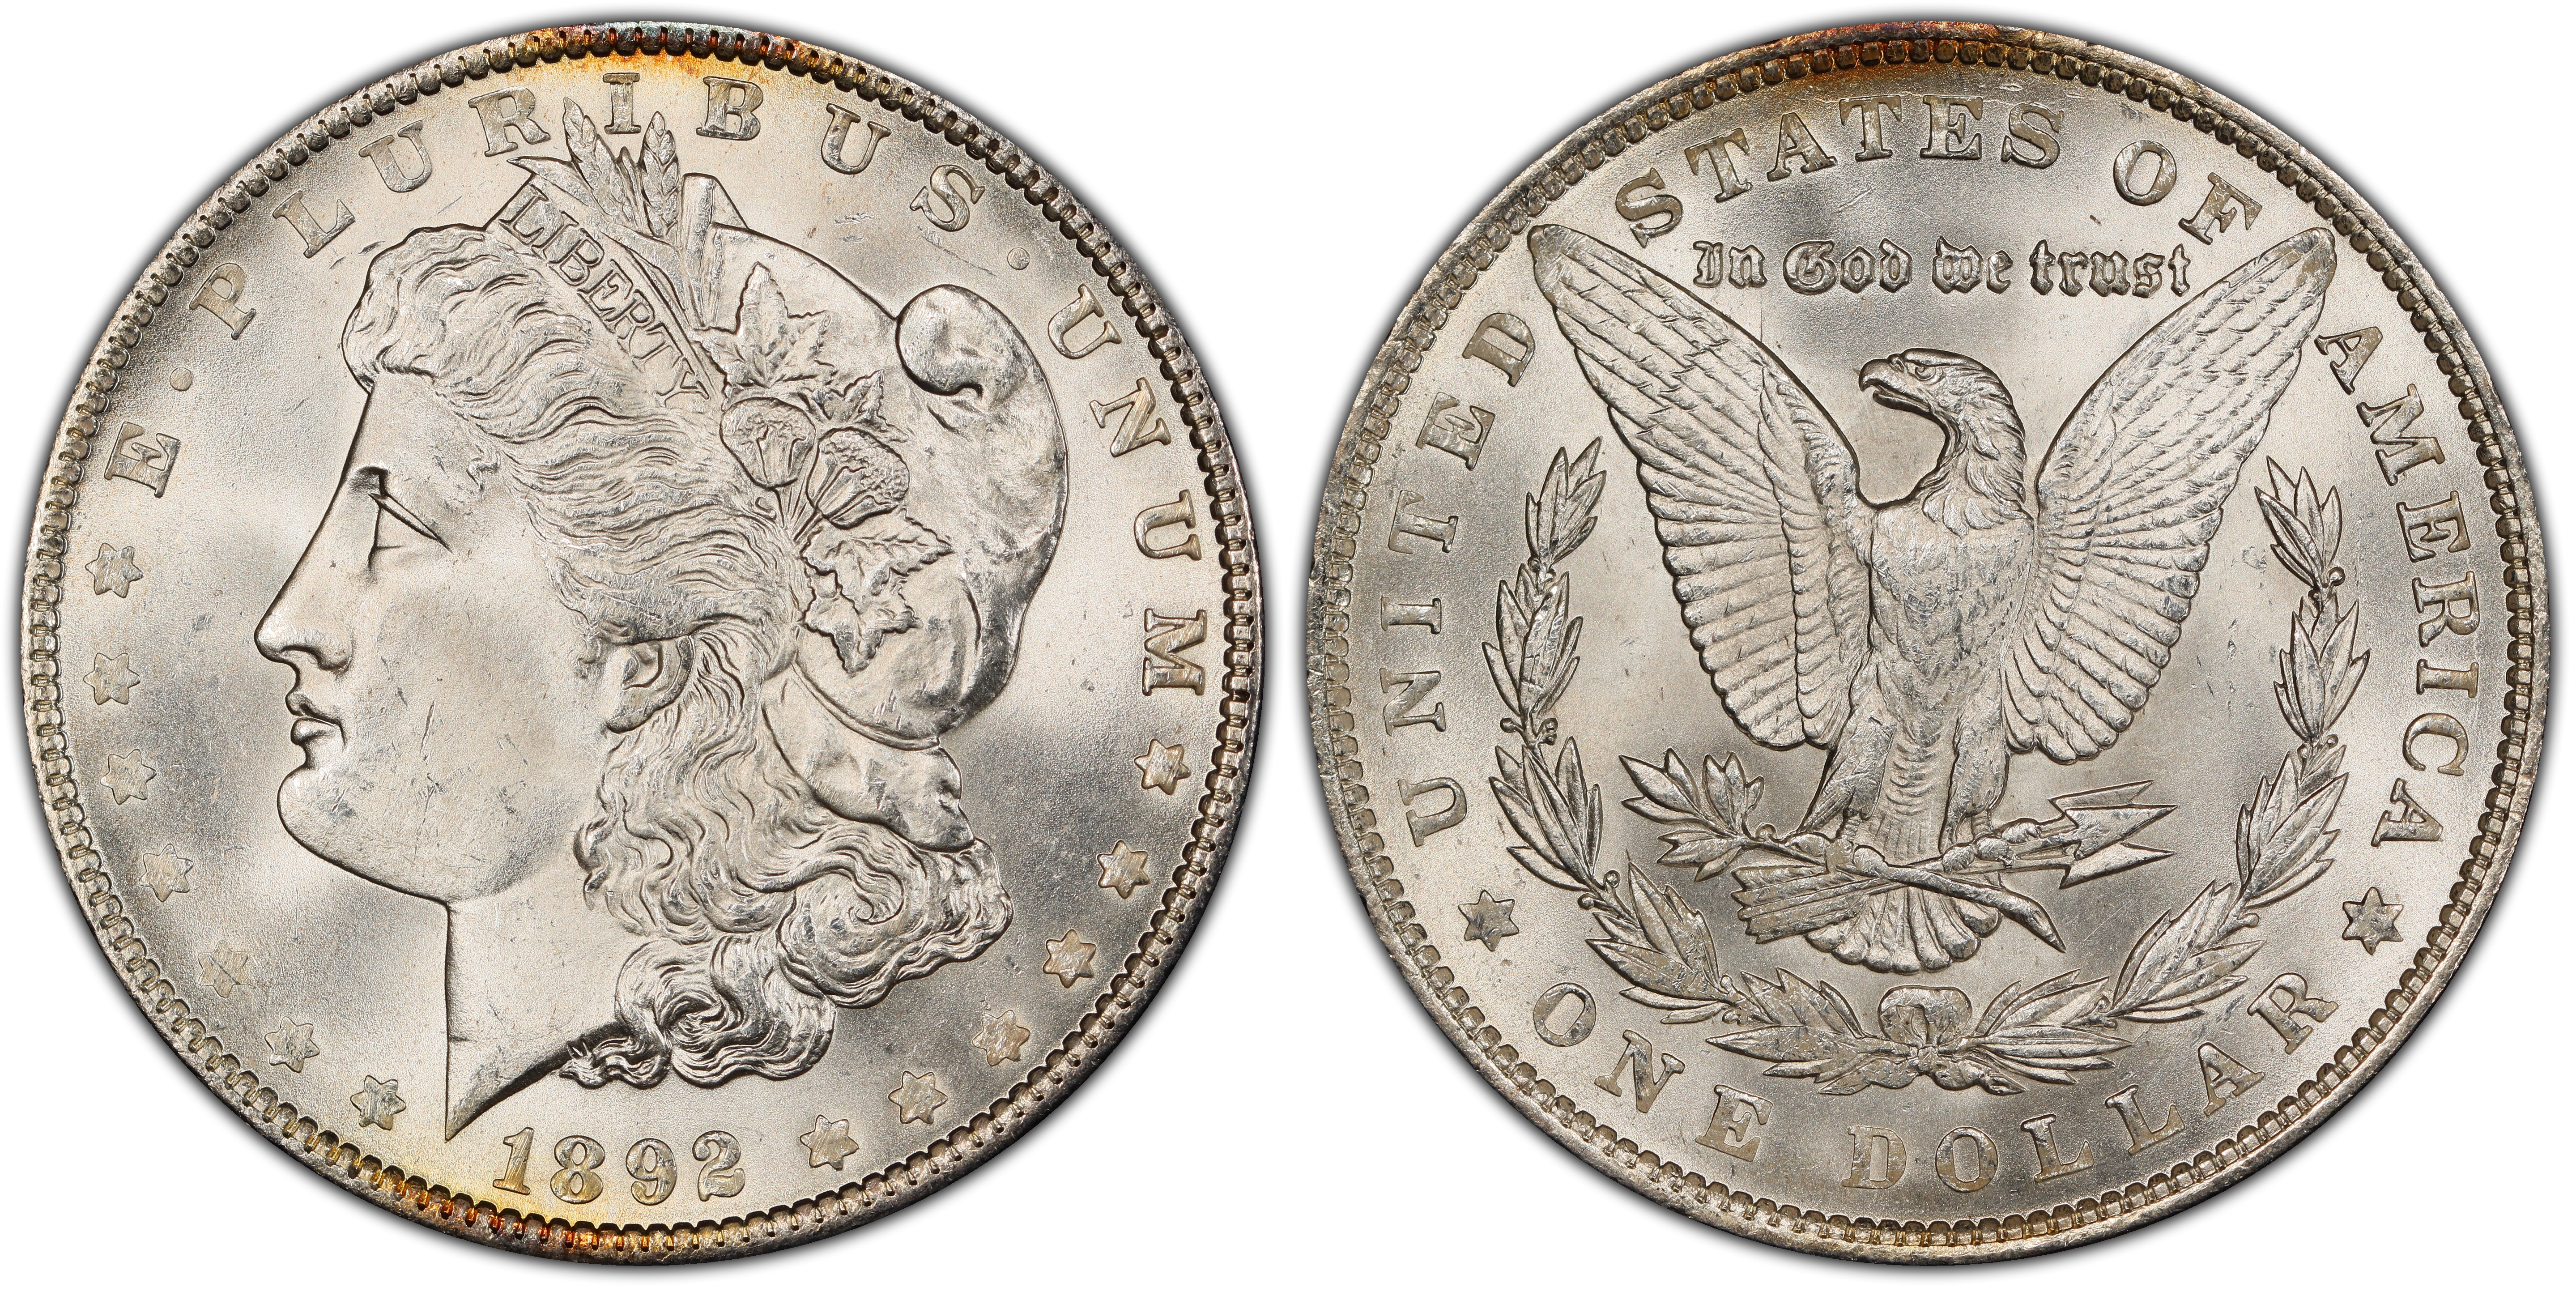

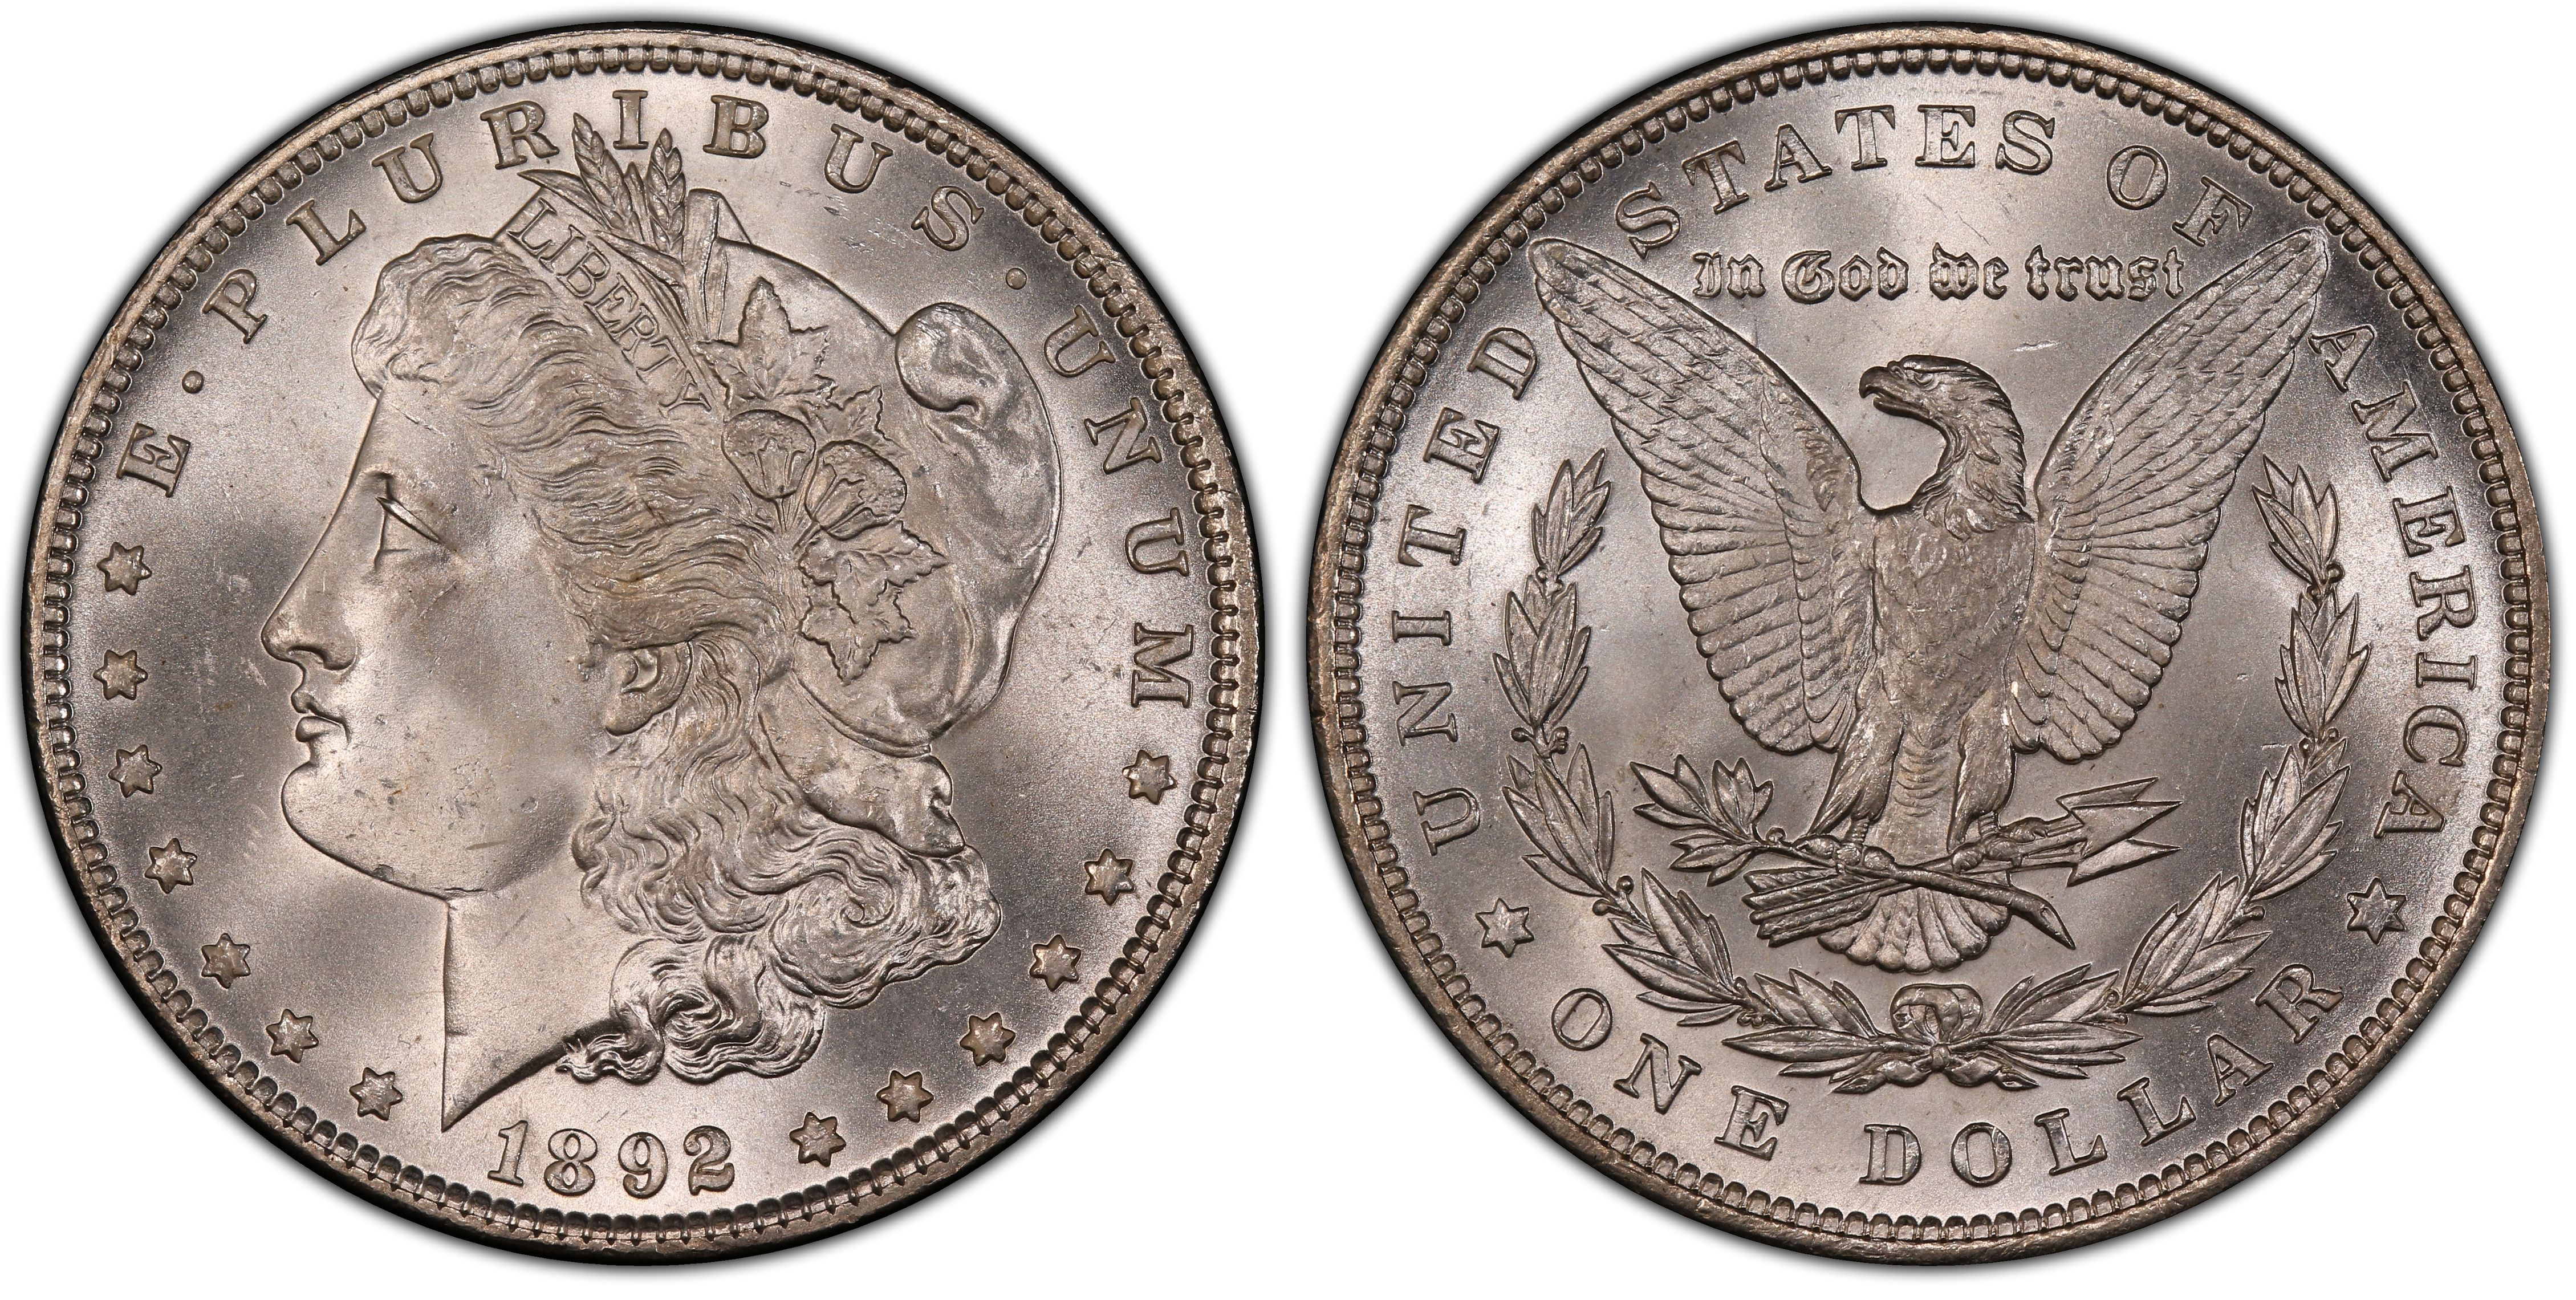
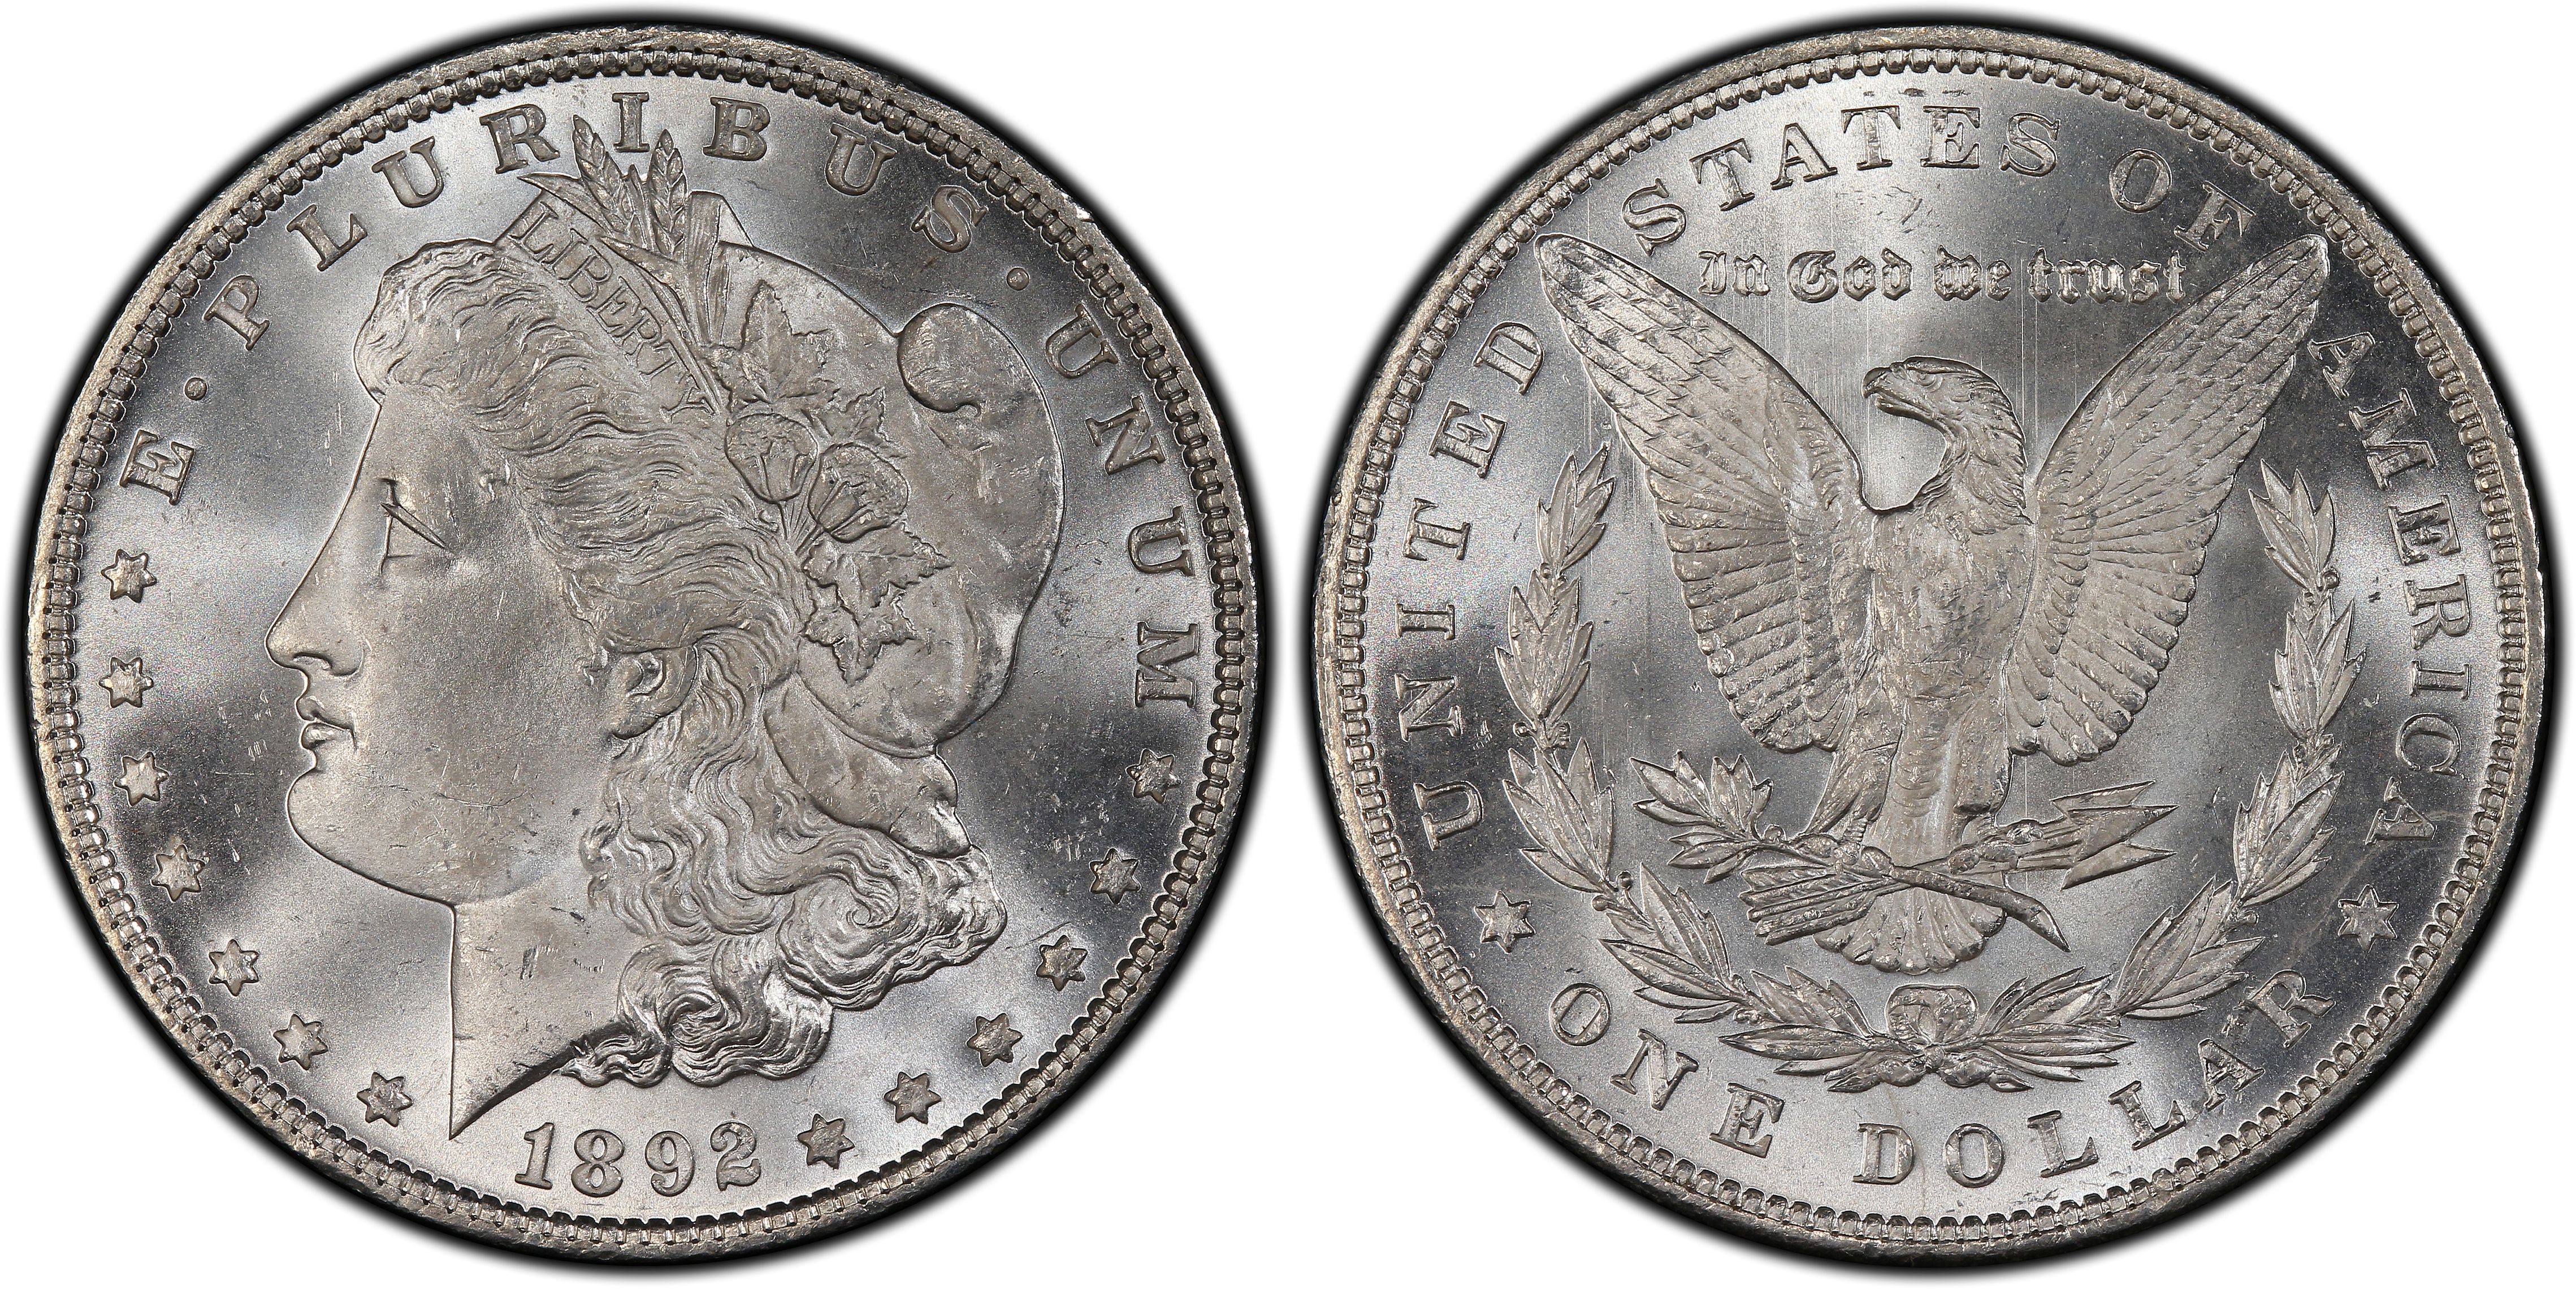
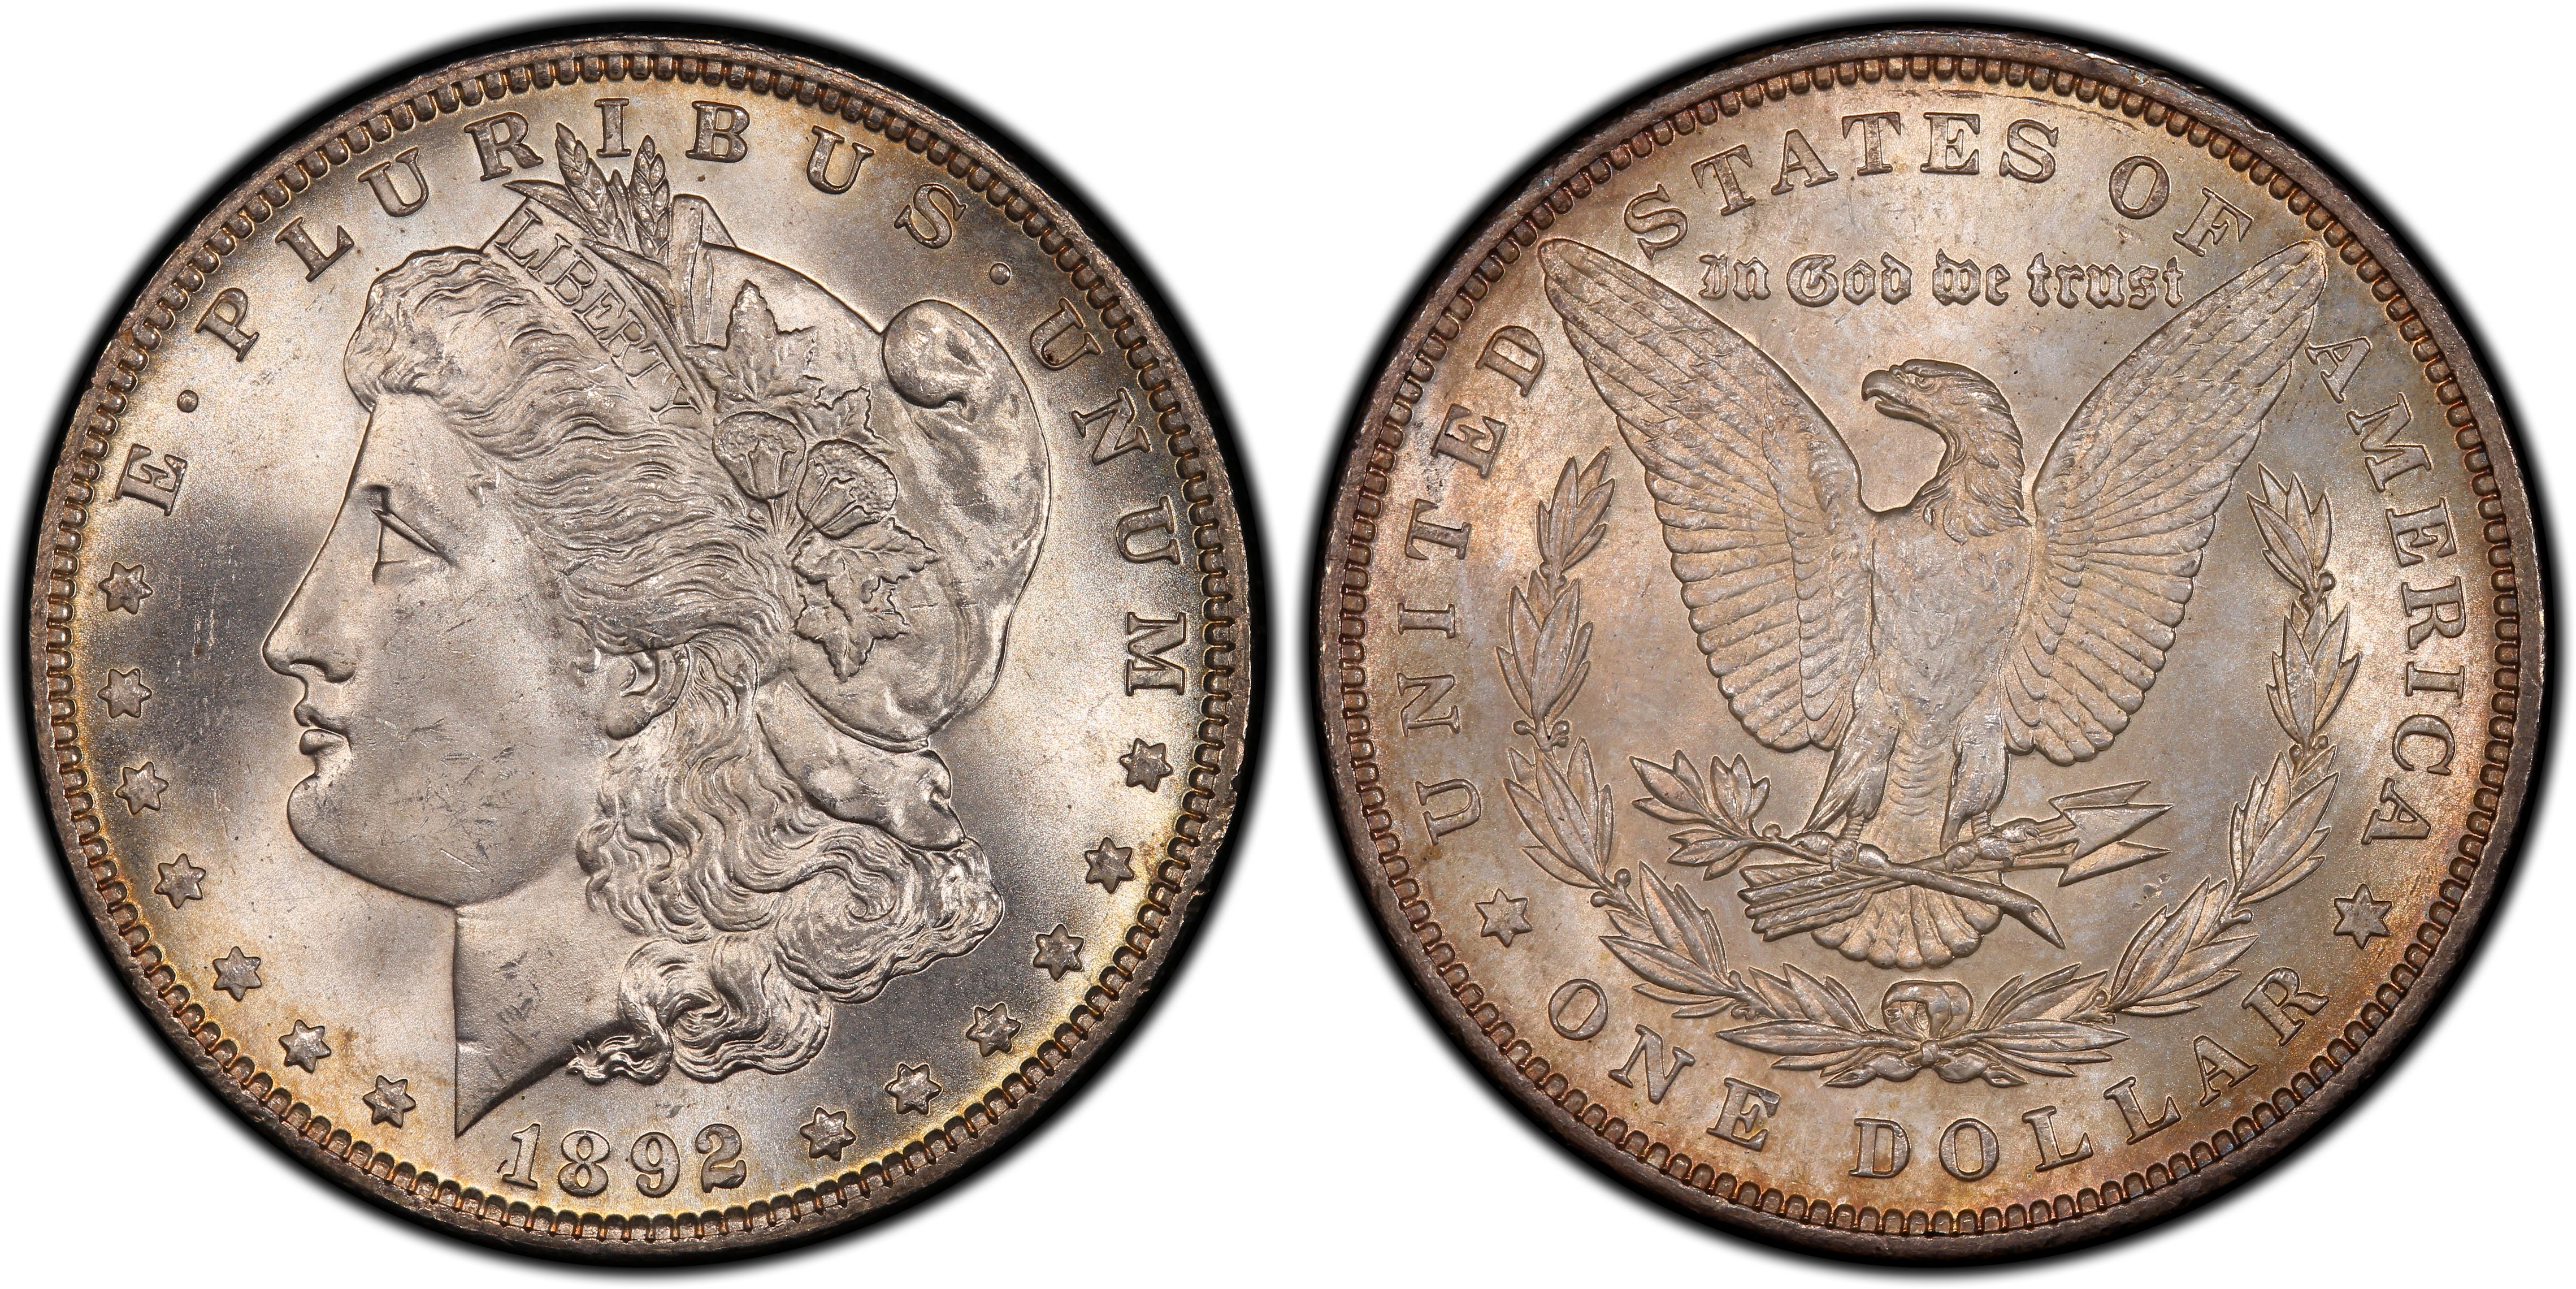
PCGS MS66
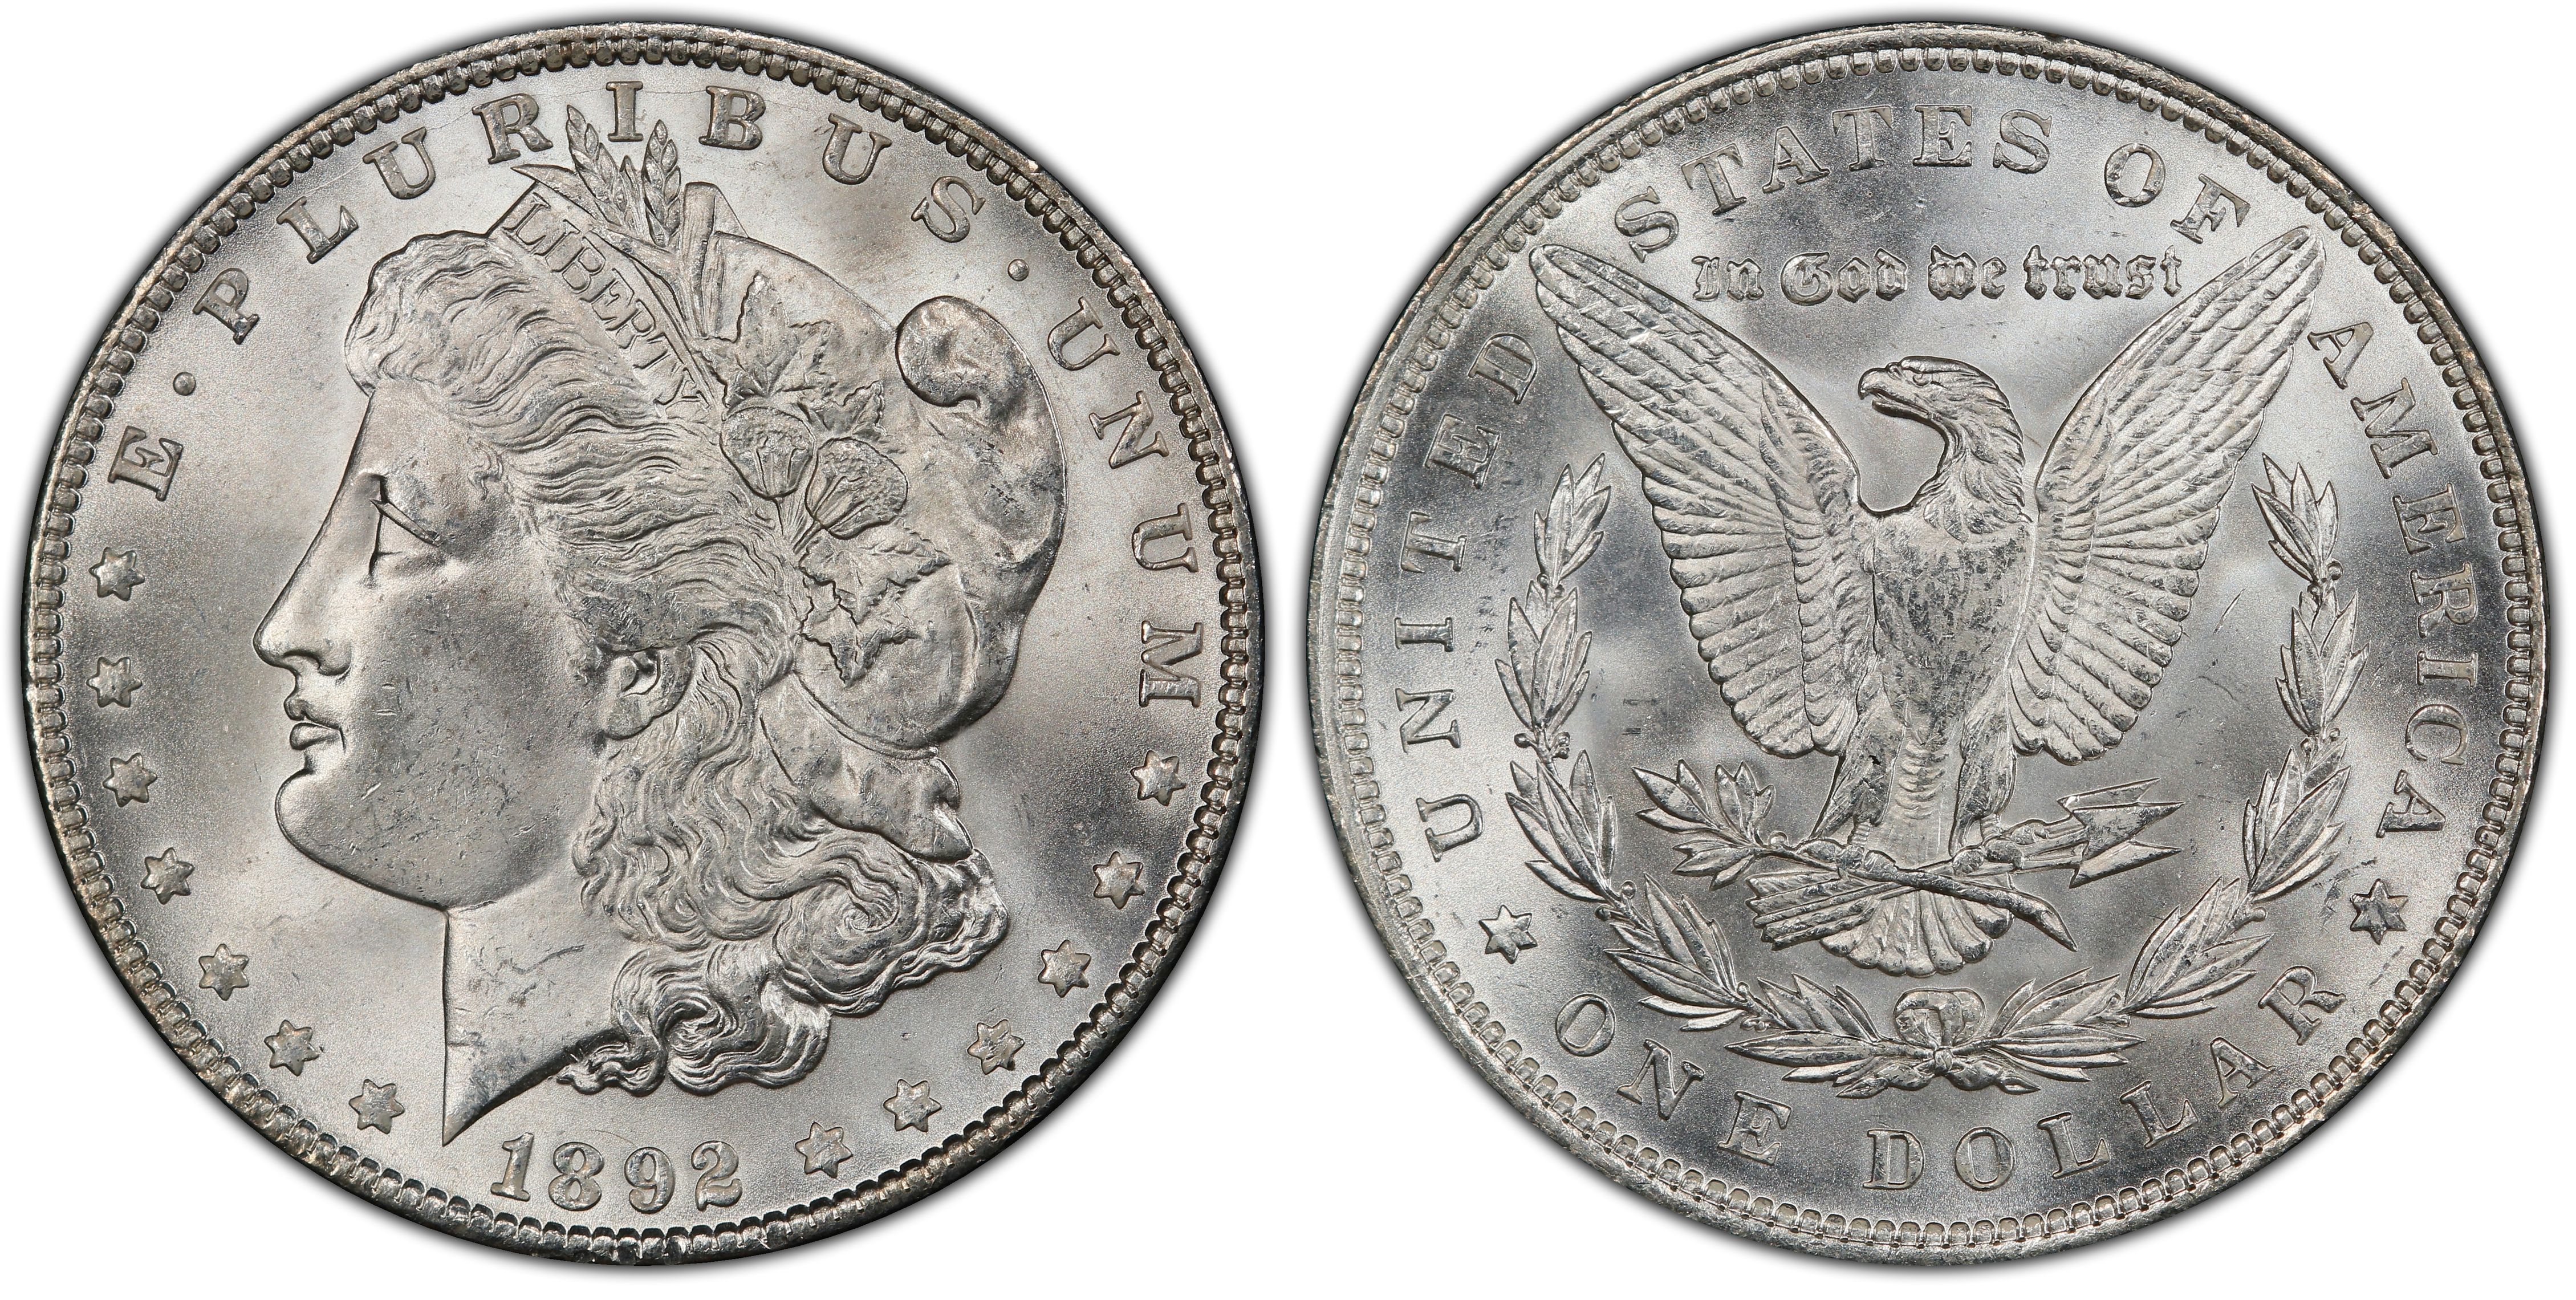
PCGS MS66
- PCGS #:
- 7212
- Designer:
- George T. Morgan
- Edge:
- Reeded
- Diameter:
- 38.10 millimeters
- Weight:
- 26.73 grams
- Mintage:
- 1,036,000
- Mint:
- Philadelphia
- Metal:
- 90% Silver, 10% Copper
- Auction Record:
- $49,938 • MS66 • 09-27-2018 • Legend Rare Coin Auctions
Die Varieties
- 1892 $1 VAM 1
- 1892 $1 VAM 1, PL
- 1892 $1 VAM 1, DMPL
- 1892 $1 VAM 2
- 1892 $1 VAM 2, PL
- 1892 $1 VAM 2, DMPL
- 1892 $1 VAM 3
- 1892 $1 VAM 3, PL
- 1892 $1 VAM 3, DMPL
- 1892 $1 VAM 4
- 1892 $1 VAM 4, PL
- 1892 $1 VAM 4, DMPL
- 1892 $1 VAM 5
- 1892 $1 VAM 5, PL
- 1892 $1 VAM 5, DMPL
- 1892 $1 VAM 6
- 1892 $1 VAM 6, PL
- 1892 $1 VAM 6, DMPL
- 1892 $1 VAM 7
- 1892 $1 VAM 7, PL
- 1892 $1 VAM 7, DMPL
Go To Grade
Current Auctions - PCGS Graded
Current Auctions - NGC Graded
For Sale Now at Collectors Corner - PCGS Graded
For Sale Now at Collectors Corner - NGC Graded
Rarity and Survival Estimates Learn More
| Survival Estimate | |
|---|---|
| All Grades | 104,000 |
| 60 or Better | 39,000 |
| 65 or Better | 888 |
| Numismatic Rarity | |
|---|---|
| All Grades | R-1.9 |
| 60 or Better | R-2.6 |
| 65 or Better | R-5.2 |
| Relative Rarity By Type All Specs in this Type | |
|---|---|
| All Grades | 33 / 117 TIE |
| 60 or Better | 42 / 117 TIE |
| 65 or Better | 40 / 117 |
| Relative Rarity By Series All Specs in this Series | |
|---|---|
| All Grades | 33 / 117 TIE |
| 60 or Better | 42 / 117 TIE |
| 65 or Better | 40 / 117 |
Condition Census What Is This?
 #1 MS66 PCGS grade
Heritage 8/2006:5361, $24,150 - Heritage 1/2009:5007, $43,125 - Coronet Collection - Legend Rare Coin Auctions 6/2015:58, $47,000 - Wurt Collection (PCGS Set Registry) |
 #1 MS66 PCGS grade
Gold River Collection |
 #1 MS66 PCGS grade
Heritage 8/2017:4050, $49,350 - IPS Collection (PCGS Set Registry) |
 #1 MS66 PCGS grade
Magnificent Morgans Collection (PCGS Set Registry) |
 #1 MS66 PCGS grade
|
 #1 MS66 PCGS grade
|
 #1 MS66 PCGS grade
|
| #1 MS66 PCGS grade |
| #1 MS66 PCGS grade |
| #6 MS65+ PCGS grade |
Q. David Bowers:
The following narrative, with minor editing, is from my "Silver Dollars & Trade Dollars of the United States: A Complete Encyclopedia" (Wolfeboro, NH: Bowers and Merena Galleries, Inc., 1993)
Numismatic Information
Once a rarity: From the time of mintage through the early decades of the twentieth century, the 1892 was a major rarity. Very few had been released into circulation. However, Proofs were available readily enough, and they took care of the need to acquire a circulation strike of the date. This situation was true of such other Philadelphia Morgan dollar dates as 1894, 1897, and 1899, among others. The relatively few transactions involving Mint State 1892 dollars sold prior to 1940 did not take place at high prices. Accordingly, the erstwhile rarity of this date was not recognized until I researched the matter in connection with the present text.
Hoard coins: Large quantities of Mint State 1892 dollars were released by the Treasury in the late 1950s and early 1960s, before which time they were rare, as noted. By the late 1950s, they were very common. Harry J. Forman reported that Uncirculated 1892 dollars were second only to 1891 dollars from the standpoint of availability through Philadelphia banks at the time. However, by the time that the Treasury began emptying its vaults in earnest, circa 1962-1964, most 1892 dollars had already been paid out. The date was not well represented among later Treasury hoard coins.
It has been suggested that the Redfield hoard had a partial bag of coins, and these mostly graded MS-60 to MS-62. By that time, most other quantities had been dispersed.
Circulated grades: 1892 dollars are plentiful in higher circulated grades but rare in lower grades. Few were placed in circulation at or near the time of striking. In 1925, numismatist E.S. Thresher reported that despite searching since 1919, he had not been able to find an example in circulation; one of just eight coins absent from his Morgan dollar collection (the others were 1884-CC, 1885-CC, 1889-S, 1893-S, 1894, 1897, and 1899). Most worn coins seen now are those that were placed into the channels of commerce well into the present century.
Mint State grades: Estimated populations have a rapid fall-off as grades increase: MS-60 to 62, 75,000 to 150,000 exist; MS-63, 20,000 to 40,000; MS-64, just 2,000 to 4,000; and MS-65 or better, only 600 to 1,200.
As a class, 1892 dollars are chameleons. Some are sharply struck with very nice lustre, and are a joy to behold. However, the typically encountered coin is apt to be flatly struck at the centers, have poor lustre, and be peppered with bagmarks. Once again, cherrypicking is advised when buying at any grade level. As always, this attention to detail will yield quality coins for your collection, while unknowing investors can take up the slack with poorly struck pieces.
Prooflike coins: Prooflike and DMPL 1892 dollars are rare. Many prooflike coins are bagmarked and/or are flatly struck. However, Wayne Miller reported that "many" prooflike coins came on the market in the 1970s. About 10% of extant DMPL coins are MS-65 or finer.
Varieties
Circulation strikes:
1. Normal date: Breen-5625. Positional varieties exist. VAM-3, Doubled Reverse, has many features doubled. VAM-6 and 7 also show doubling on the reverse. VAM-5 has a doubled profile to Miss Liberty and tripling of E PLURIBUS UNUM. Probably not all nine pairs of dies were used.
Dies prepared: Obverse: 9; Reverse: 9.
Circulation strike mintage: 1,036,000; Delivery figures by month:(Coinage of June from silver under the Act of July 14, 1890; coinage of later months from trade dollar bullion under the Act of March 3, 1891, disposing of 960,535 trades) January-May: none; June: 58,000; July: 68,000; August: 110,000; September: 200,000; October: 200,000; November: 200,000; December: 200,000.
Estimated quantity melted: Probably hundreds of thousands, mainly under the 1915 Pittman Act.
Characteristics of striking: Striking varies dramatically from coin to coin. Some are flatly struck with poor lustre, and others are sharply struck, attractive, and frosty.
Known hoards of Mint State coins: Many bags were released by the Treasury in the 1950s and very early 1960s (before autumn 1962)
Additional Information
Sources of Silver
The Annual Report of the Director of the Mint, 1892, gave a summary of the sources of silver used to produce dollars:
"The mandatory coinage of two million ounces of silver, purchased under the Act of July 14,1890, into silver dollars, ceased at the close of the fiscal year ended June 30, 1891, and during the past fiscal year only a limited coinage of dollars was executed from such bullion.
"The quantity and cost of silver used in this coinage was 2,669,128.95 fine ounces, costing $2,577,838.19, while 18,497.48 fine ounces, costing $18,073.24 were wasted and sold in sweeps, leaving a balance of uncoined silver purchased under the Act of July 14, 1890, on hand at the coinage mints June 30, 1892, of 78,927,665.42 fine ounces, costing $76,314,868.17, distributed as follows ....
"Shortly after April 1, 1873, when the Act of February 12, 1873, revising the coinage laws of the United States, went into effect, the government commenced the purchase of silver in order to supply a fund, as required by that act, from which depositors of silver for fine bars and for trade dollars authorized to be coined therein could be promptly paid, as well as to furnish silver for such subsidiary coin as might be required by the government. Nearly all the silver acquired under this act was purchased for delivery at the mints at San Francisco and Carson City, for the reason that the State and Territories contiguous to these mints were at that time the principal sources of the production of silver. The Act of January 14, 1875, known as the specie resumption act, directed the purchase and coinage into subsidiary silver coins of a sufficient amount to replace the fractional currency in circulation. For this purpose there was purchased in the next three years no less than 31,603,905.87 ounces of silver. By reason of the facilities with which shipments of silver could be made from San Francisco to oriental countries the price of silver on the Pacific coast was generally higher than the price in London.
"Upon the passage of the Act of February 28,1878, remonetizing the silver dollar and directing the purchase and coinage into silver dollars of not less than $2 million worth of silver monthly, sellers of silver on the Pacific coast demanded a price of from 1 to 2 cents an ounce more than silver could be bought for in the London market and delivered at the mints of the United States.
"For this reason recourse was had by the secretary of the Treasury to the London market, and some five million ounces of silver were purchased there for delivery at the Philadelphia mint. After this it was not necessary to resort to the London market, as all the silver required was readily procured either in San Francisco or in New York at the market price.
"Prior to 1879 the greater part of the silver required by the government was purchased in the markets of the Pacific coast, but this was changed by the large falling off in the silver product of Nevada and the large increase in the silver product of the States and Territories penetrated by railroads from the East, and the consequent facility with which ores could be shipped to the eastern smelting and refining works for reduction. Moreover, in recent years the demand for silver upon the part of China and other Oriental countries has fallen off very largely, and in consequence the silver product of the country seeks the most available outlet, which is through the New York market, where it is either sold to the government or shipped to London.
"Of the silver purchased under the Act of July 14, 1890, to November 1, 1892, 103,047,180 fine ounces out of a total amount purchased of 120,479,981 were delivered at eastern mints, the principal portion at the Philadelphia Mint.
"The aggregate amount of silver bullion purchased under the Act of July 14, 1890, from August 13, 1890, to November 1, 1892, was 120,479,981 fine ounces, costing $116,783,590, an average cost of $0.969 per fine ounce.
"In addition to the silver dollars coined under the Act of July 14, 1890, there were coined from the balance of trade-dollar bullion on hand June 30, in accordance with the provisions of the Act of March 3, 1891,4,878,472 silver dollars .... "
Distribution of Silver Dollars
The Annual Report of the Director of the Mint, 1892, told of the number of silver dollars being held at the mints:
In mints July 1, 1891: Philadelphia 51,163,675; San Francisco 36,362,220; New Orleans, 10,884,500; Carson, 2,880,360; total 101,290,755.
Coinage of the fiscal year: Philadelphia, 1,602,851; San Francisco" 876,000; New Orleans, 4,458,616; Carson, 1,392,000; Total, 8,329,467.
In mints July 1,1892: Philadelphia, 50,083,000; San Francisco, 36,301,366; New Orleans, 9,701,300; Carson,4,126,636; total, 100,212,302.
Distributed: Philadelphia, 2,683,526; San Francisco, 936,854; New Orleans, 5,641,816; Carson, 145,724; total, 9,407,920.
Silver Dollars in Circulation
The Annual Report of the Director of the Mint, 1892, gave this information: On July 1, 1892 it was estimated that 357,171,273 silver dollars were owned by the Treasury Department, 7,466,596 were in national banks (as of July 12, 1892), and 49,350,866 were in general circulation and in other banks for a total of 413,988,935 silver dollars.
Further:
"The number of silver dollars in actual circulation, that is, outside of the Treasury, on July 1, 1892, was 56,817,462, against 58,826,179 at the commencement of the fiscal year, showing that the number of silver dollars in bodily circulation fell off during the last fiscal year $2,008,717, notwithstanding the fact that the government stands ready to ship such coins, free of expense, to any person in the United States depositing lawful money for the same.
"The number of silver dollars owned by the Treasury on July 1, 1892, was 39,308,448, against an ownership of 39,597,123 at the commencement of the year, showing that the number of these dollars owned by the government was reduced $288,675 during the year."
Cost of Producing Silver Dollars
The costs of producing coins, not including minor coins, at each mint in fiscal year 1892, per the Annual Report of the Director of the Mint, 1892: Philadelphia $0.0146+; San Francisco, $0.029+; New Orleans, $0.0118-; Carson, $0.0764+. Further:
"It is exceedingly gratifying to report that the cost per piece of coinage executed was reducing during the last fiscal year from an average of nearly one cent to an average of eight-tenths of one cent, while the cost per piece, exclusive of minor coins struck, was reduced from about two cents in 1891 to one and eight-tenths in 1892.
"The economy, however, is more marked when the cost of coinage is compared with the year 1890, when the average cost of coinage executed exceeded one cent per piece, or, excluding minor coins, two and one-half cents apiece.
"The percentage of good coins produced from ingots operated upon for the fiscal year 1892-silver ingots-was as follows: Philadelphia 52.3%, San Francisco 47%, New Orleans 49.1 %; Carson 54.1 %, showing that Carson City had the most efficient conversion of ingots to coins. This percentage figure is calculated by determining the weight of the ingots in relation to the weight of the finished coins received. There is wastage in the preparation of strips, cutting out planchets from the strips, etc., accounting for the difference."
Silver-Producing States
The production of silver for the calendar year 1892 was estimated by the Director of the Mint and published the Annual Report of the Director of the Mint, 1893:
Fine ounces: Alaska 8,000, California 360,000, Colorado 24 million, Georgia 400, Idaho 3.2 million, Michigan 60,000, Montana 17 million, Nevada 2.2 million, New Mexico 1.1 million, Oregon 50,000, South Carolina 400, South Dakota 60,000, Texas 310,000, Utah, 8 million, Virginia 1,000, Washington 150,000.